Cameron Coleman · 4 September 2026
Mapping Visibility Shifts During Backend Transitions Through Integrated Monitoring Systems
Backend transitions often create unexpected visibility shifts across digital platforms, and integrated monitoring systems provide the data streams needed to track those changes in real time. Organizations rely on these systems to capture performance indicators, traffic patterns, and indexing signals while infrastructure updates occur behind the scenes. Data from multiple sources shows that transitions completed without continuous oversight frequently produce measurable drops in search visibility that persist for weeks or longer.
Core Components of Integrated Monitoring
Effective monitoring setups combine application performance management tools, log aggregation platforms, and search analytics interfaces into a single operational view. Teams configure alerts that trigger when crawl frequency changes, response times increase, or indexing errors spike during migration windows. According to reports from the National Institute of Standards and Technology, such layered approaches reduce undetected anomalies by linking infrastructure events directly to external visibility metrics.
Researchers at several academic institutions have documented how these connections reveal patterns that isolated tools miss. One study tracked a series of database migrations and found that visibility declines correlated strongly with temporary increases in server latency rather than outright downtime. The findings highlight why teams now prioritize unified dashboards that surface both internal health checks and external search data in the same interface.
Tracking Visibility Metrics Through Transition Phases
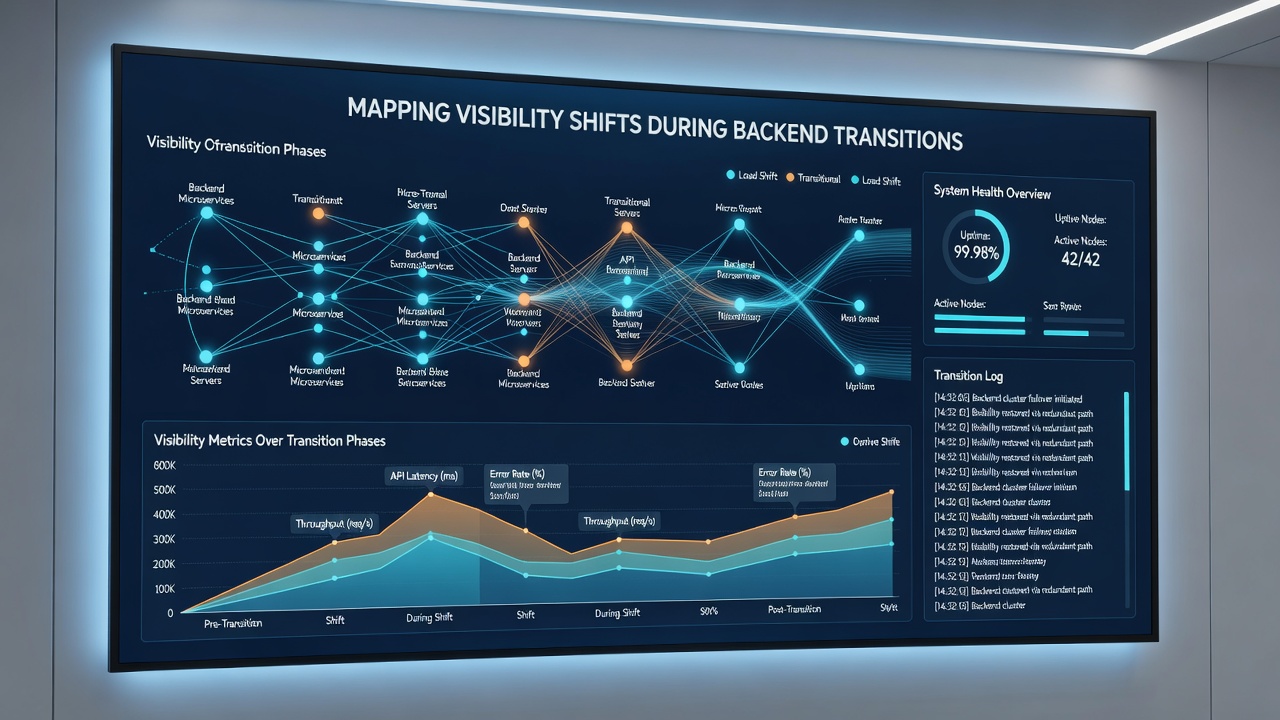
Visibility mapping begins before any backend change starts. Baseline measurements establish normal ranges for key indicators such as organic traffic volume, crawl budget utilization, and ranking positions across target keywords. During the transition itself, monitoring systems record deviations at granular intervals, often every few minutes, so analysts can correlate specific deployment steps with observed shifts.
Post-transition analysis compares new data against the established baseline to quantify recovery time and identify any permanent alterations. Evidence collected across multiple enterprise projects indicates that most visibility fluctuations stabilize within fourteen to twenty-one days when monitoring remains active throughout the process. September 2026 projections from industry research groups suggest that adoption of real-time correlation engines will shorten this stabilization window further as automation improves.
Case Examples from Recent Implementations
One logistics company completed a full content delivery network migration while running continuous monitoring across both infrastructure and search console feeds. Observers noted an initial 12 percent drop in indexed pages that reversed within ten days after the system flagged duplicate canonical tags introduced during the switch. The team adjusted configurations immediately because alerts surfaced the issue before search engines fully processed the changes.
A separate healthcare platform migration used similar monitoring layers to track API response consistency. Data revealed that certain regional endpoints experienced higher latency, which coincided with reduced crawl rates from international search bots. Adjustments to load balancing rules restored visibility levels without requiring a full rollback.
Common Data Sources and Integration Methods
Monitoring frameworks pull information from server logs, application traces, content delivery metrics, and public search APIs. European Union digital infrastructure reports emphasize the value of combining these streams with regulatory compliance logs to maintain audit trails during transitions. Teams often deploy middleware that normalizes timestamps across sources so correlations remain accurate even when systems operate in different time zones.
Academic papers on distributed systems monitoring describe techniques that weight visibility signals according to their predictive strength. Crawl frequency changes, for instance, tend to precede ranking shifts by several days, giving teams a window to intervene before broader visibility losses occur.
Conclusion
Mapping visibility shifts during backend transitions depends on integrated monitoring that connects internal system events with external performance indicators. Organizations that maintain continuous data collection across both domains consistently identify and address issues faster than those relying on fragmented tools. Current implementations demonstrate that unified visibility tracking supports smoother transitions and more predictable recovery timelines across diverse technical environments.